BlueINDO focuses on Blue Carbon Projects within Indonesia.
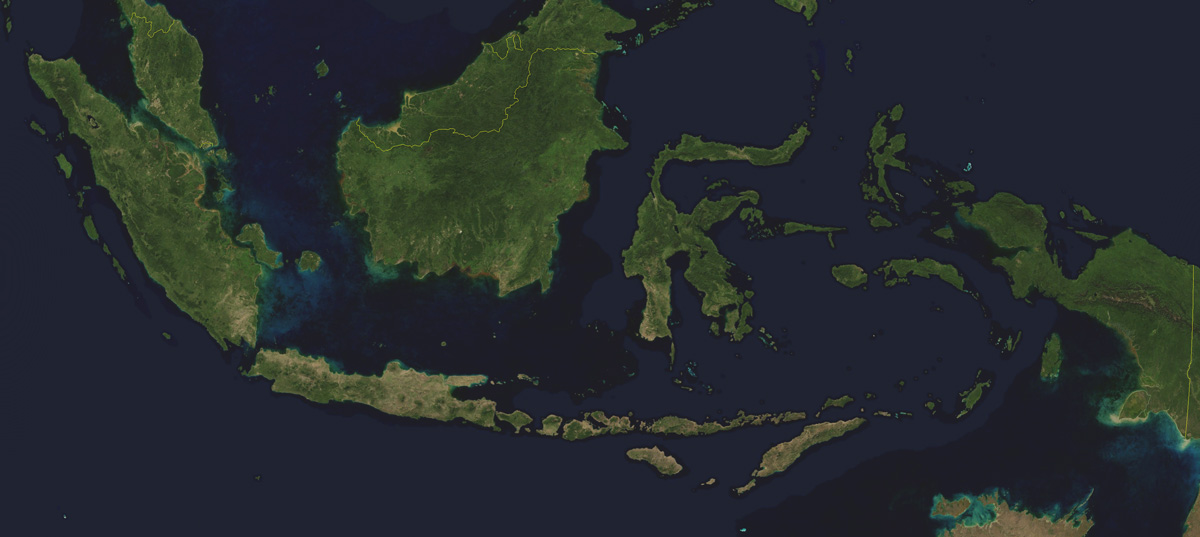
Indonesia is an archipelago (archipelagic country) of roughly 17,508 islands, according to the CIA World Factbook. With a total land area of 1,904,569 square kilometres (735,358 sq mi), including 93,000 square kilometres (35,908 sq mi) of inland seas (straits, bays, and other bodies of water), Indonesia is the largest island country in the world. Additional surrounding sea areas bring Indonesia’s generally recognized territory (land and sea) to about 5 million km2. [Wikipedia]
About 3 million hectares of mangrove forest grow along Indonesia’s 95,000 km coastline – the fourth largest coastline in the world. Housing 22.6% of all mangroves on Earth, Indonesia boasts the world’s largest mangrove population. It is estimated Indonesia’s mangroves contain 3.14 billion metric tonnes of carbon – one third of global coastal carbon stocks.
Our project areas are validated and verified by a variety of Greenhouse Gas Emission Standards. Check out our Knowledge Corner to learn more about these standards, certifications and frameworks.
Peat Forest Conservation Projects:
BlueINDO Project Areas
BKI79
Quick OverviewProject ID: BKI79
79,000 Ha Mangrove (Conservation)
3,675 tCO2 per Ha (Average)
290,325,000 Avoided tCO2 Emissions (Total, 30 years)
9,677,500 Avoided tCO2 Emissions (Annual)
BKI70
Quick OverviewProject ID: BKI70
70,000 Ha Mangrove (Conservation)
3,425 tCO2 per Ha (Average)
239,750,000 Avoided tCO2 Emissions (Total, 30 years)
7,991,667 Avoided tCO2 Emissions (Annual)
Peat Forest Project Areas:
BKI152
Quick OverviewProject ID: BKI152
152,136 Ha Peat Forest (Conservation)
2,550 tCO2 per Ha (Average)
387,946,800 Avoided tCO2 Emissions (Total, 30 years)
12,931,560 Avoided tCO2 Emissions (Annual)
BKI100
Quick OverviewProject ID: BKI100
100,099 Ha Peat Forest (Conservation)
2,550 tCO2 per Ha (Average)
255,252,450 Avoided tCO2 Emissions (Total, 30 years)
8,508,415 Avoided tCO2 Emissions (Annual)
BKU124
Quick OverviewProject ID: BKI124
124,115 Ha Peat Forest (Conservation)
2,550 tCO2 per Ha (Average)
316,493,250 Avoided tCO2 Emissions (Total, 30 years)
10,549,775 Avoided tCO2 Emissions (Annual)
Deforestation and the destruction of peatlands make Indonesia the world’s third largest emitter of greenhouse gases. Habitat destruction threatens the survival of indigenous and endemic species, including 140 species of mammals identified by the World Conservation Union (IUCN) as threatened, and 15 identified as critically endangered, including the Sumatran Orangutan.
Further Reading